Vital Health Statistics
Demography
The word “demography” is derived from two ancient Greek words: “demos,” meaning “the people,” and “graphy,” meaning “writing about or recording something.” Therefore, literally, demography means “writing about the people or measurement.” Like many branches of science, demography originated in the 19th century. A related term is “demographics,” which refers to the raw statistical data used for analysis.
Demography is the scientific study of the human population, with a primary focus on three observable phenomena:
- Changes in population size, whether through growth or decline.
- The composition of the population.
- The distribution of the population in space.
The demographic processes that contribute to these phenomena include fertility, mortality, marriage, migration, and social mobility. History demonstrates that every nation undergoes a sequence of five stages in the demographic cycle.

- First stage (High Stationary): This stage is characterized by a high birth rate and a high death rate, which offset each other, resulting in a relatively stationary population. India and Nepal were in this stage until 1920.
- Second stage (Early Expanding): During this stage, there is a decline in the death rate while the birth rate remains unchanged, leading to population expansion. Many developing countries in Asia and Africa are currently in this stage.
- Third stage (Late Expanding): During this phase, the death rate continues to decline, and the birth rate starts to fall. However, there is still a population increase because births exceed deaths. India appears to have entered this stage.
- Fourth stage (Low Stationary): Characterized by both a low birth rate and a low death rate, this stage results in a stationary population. Countries such as Sweden, Belgium, Denmark, and Switzerland are currently in this stage.
- Fifth stage (Declining): In this stage, the population begins to decline as the birth rate is lower than the death rate. East European countries, such as Germany and Hungary, are currently in this stage.
These stages provide a framework for understanding how populations change over time, and they are essential for studying and addressing various demographic and socio-economic challenges in different regions of the world.
Significance of demography to community health:
Demography plays a crucial role in various fields related to community health.
- Its applications include:
- Public health
- Local planning for land use
- School construction
- Marketing
- Public activities
- Manpower analysis
- Family planning programme
- Land settlement
2. Demography is beneficial in:
- Political area
- Economic area
- Social area
- Planning area
- Administration area
3. Demography is useful for assessing the health status of the community, measuring health trends over time, and identifying health problems.
4. Demography involves a detailed study of the population. People group based on their interests, living standards, food habits, and other social and cultural backgrounds.
5. Present the total population figures using rates, ratios, and proportions.
6. Conduct epidemiological research, addressing health problems.
7. Compare population statuses at the local, national, and international levels.
8. Play a crucial role in various types of research.
9. Significantly contribute to planning, supervising, monitoring, and evaluating different programs.
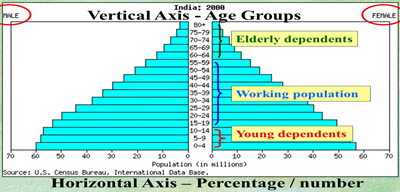
Population pyramid
A population pyramid, also known as an age pyramid or age distribution diagram, is a graphical representation that displays the distribution of various age groups in a population, typically that of a country or region. It takes the shape of a pyramid when the population is growing. This population pyramid helps us understand the demographic composition of a country, district, or Village Development Committee, providing insights into the percentage of infants, children, adults, and elderly individuals. It also reveals differences in male and female mortality, which can be influenced by specific conditions such as war or epidemics. Furthermore, it illustrates fertility patterns, dependency ratios, and whether a country is developed or developing.
Population pyramids can be interpreted based on their structure, such as a broad base and tapering top in developing countries, or a narrow base and a bulging middle. The pyramid is composed of bars, each drawn proportionally to represent the percentage contribution of each age and sex group, often in 5-year age increments, to the total population, with the total area of the bars summing up to 100%. The shape of the pyramid reflects the predominant factors influencing births, deaths, and changes due to migration over the third or fourth generation preceding the pyramid’s data.
Basic shapes of population pyramids
Expansive pyramid: An expansive population pyramid is a graphical representation used to depict populations that are youth and experiencing growth. These pyramids are typically recognized by their characteristic ‘pyramid’ shape, featuring a wide base and a narrow top.

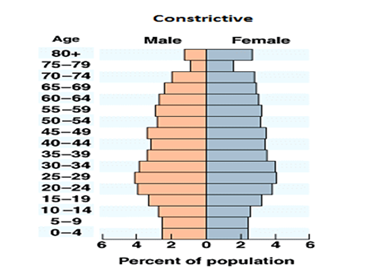
Constrictive pyramid: A constrictive population pyramid is characterized by its narrowing at the base, indicating that the population is generally older on average. This trend is often associated with a high life expectancy, a low death rate, and a low birth rate. Consequently, the percentage of younger individuals in the population is significantly reduced, which can lead to challenges in terms of the population’s dependency ratio.
Stationary: A stationary, or nearly stationary, population pyramid is employed to depict populations that are not experiencing growth. A population pyramid is considered stationary when the percentages of population within various age and sex groups remain constant over time. This typically occurs when a population has roughly equal birth and death rates, resulting in a stable demographic structure.

Tools of measurement
- Rate: Rate measures the occurrence of a particular event (such as the development of a disease or the occurrence of death) in a population during a given time period. It indicates changes in events that take place in a population over time. For example,

b. Ratio: Ratio expresses a relation in size between two random quantities, denoted as X: Y, and is the result of dividing one quantity by another. In a ratio, the numerator is not a component of the denominator. Examples include the sex ratio, population-to-nurse ratio, and child-to-women ratio.
Sex Ratio: The ratio of males to females in a population. In most sexually reproducing species, the ratio tends to be 1:1.
Dependency Ratio: A study of the population’s productive part, arbitrarily defined as the ratio of the elderly (65 years and above) plus the young (under 15 years of age) to the population in working ages (15-64 years of age).

c. Proportion: Proportion is a ratio that indicates the relationship in magnitude of a part to the whole, with the numerator always included in the denominator. A proportion is often expressed as a percentage, as shown in the following formula:

Numerator: Numerator refers to the number of times an event occurs in a population during a specified time period. The numerator is a component of the denominator when calculating a rate but not in a ratio.
Denominator: The numerator has little meaning unless it is related to the denominator. Therefore, an appropriate denominator should be chosen when calculating a rate. The denominator may be related to the population or to the total events, midyear population, population at risk, or subgroups of the population.
Health indicators
A crucial question often asked is: “How healthy is a community?” Health indicators are essential not only for assessing the health status of a community but also for comparing one country’s health status with another. They are vital for allocating scarce resources, monitoring and evaluating health services, activities, and programs, helping measure the achievement of program objectives and targets.
Health indicators are specific measures or metrics used to assess the overall health and well-being of individuals, communities, or populations. These indicators are valuable tools for healthcare professionals, researchers, policymakers, and public health officials as they provide insights into the status of a person’s or a group’s health.
Characteristic of indicators
Indicators are granted scientific respectability, exemplified by ideal indicators.
Validity: Indicators should be valid, meaning they genuinely measure what they are intended to measure.
Reliability and objectivity: Indicators should be reliable and objective; consistent results should be obtained when measured by different individuals in similar circumstances.
Sensitivity: Indicators should be sensitive, meaning they can detect changes in the situation under consideration.
Specificity: Indicators should be specific, reflecting changes solely in the situation being assessed.
Feasibility: Indicators should be feasible, possessing the ability to obtain the necessary data for measurement.
Relevance: Indicators should be relevant, contributing to the understanding of the phenomenon of interest.
Classification of indicators
Our comprehension of health cannot rely on a single indicator; it must be conceived in terms of a profile, incorporating various indicators, which may be categorized as:
- Mortality indicators
- Morbidity indicators
- Fertility indicators
- Disability rates
- Nutritional status indicators
- Health care delivery indicators
- Utilization rates
- Indicators of social and mental health
- Environmental indicators
- Socio-economic indicators
- Health policy indicators
- Indicators of quality of life
- Other indicators
- Mortality Indicators
Mortality, or death rate, is a metric that quantifies the number of deaths (either overall or attributed to a specific cause) within a specific population, normalized to the size of that population, over a given unit of time.
- Crude Death Rate (CDR): This serves as a general indicator of the overall health status of a population. It is calculated as the number of deaths per 1,000 populations per year within a specific community, typically based on the mid-year population. The CDR reflects the pace at which individuals within the community are experiencing mortality. While health assessment ideally extends beyond mere mortality statistics, in some countries, the CDR remains a primary indicator due to data availability. However, for international comparisons, its utility is limited as it can be influenced by the age-sex composition of the population. While not an exhaustive measure of health status, a decline in the death rate serves as a valuable tool for evaluating overall health improvement within a population. The reduction in the number of deaths is a clear objective of healthcare and medicine, and the success or failure to achieve this goal serves as an indicator of a nation’s dedication to enhancing health.

b. Neonatal Mortality Rate (NMR): – Neonatal deaths are defined as deaths occurring during the neonatal period, starting at birth and concluding at 28 completed days after birth. The NMR is calculated as the number of neonatal deaths in a given year per 1,000 live births in that same year. The neonatal mortality rate was 21 deaths per 1,000 live births (Nepal Demographic and Health Survey, 2022)

Causes of neonatal mortality rate
- Birth injuries
- Congenital malformation
- Low birth weight
- Asphyxia
- Atelectasis
Neonatal mortality rate is directly associated with birth weight and gestational age. The lower the birth weight or the more premature the baby, the higher the likelihood of mortality.
c. Perinatal Mortality Rate (PMR): – The term perinatal mortality encompasses both late fetal deaths (stillbirths) and early neonatal deaths. According to the 8th revision of the International Classification of Diseases (ICD), the “perinatal period” is defined as extending from the 28th week of gestation to the 7th day after birth. The 9th revision of the ICD specifies that perinatal mortality includes late fetal deaths, live births, and early neonatal deaths with a birth weight above 1000 grams per 1000 live births. It can be expressed by the formula:

Causes of perinatal mortality rate
- Antenatal causes: maternal diseases, pelvic diseases birth defects of reproductive organs, Rh incompatibility, toxemia in pregnancy, antepartum hemorrhage.
- Intra natal causes: birth injury, asphyxia, obstetric complications.
- Post-natal causes: premature baby, respiratory distress syndrome, congenital anomalies, infection
The perinatal mortality rate is 27 deaths per 1,000 pregnancies of 28 or more weeks’ duration. Stillbirths account for more than one-third of perinatal mortality. (NDHS, 2022)
d. Infant Mortality Rate (IMR): The IMR is defined as the number of deaths under 1 year of age in a given year divided by the total number of live births in the same year, typically expressed as a rate per 1000 live births. It stands as one of the most widely recognized indicators of health status, offering insights not only into the well-being of infants but also reflecting the overall health of the population and the socio-economic conditions in which they reside. Furthermore, the infant mortality rate serves as a sensitive indicator of the accessibility, utilization, and effectiveness of healthcare, especially perinatal care. IMR is regarded as the most sensitive index of the health of the community. It is one of the most universally accepted indicators of health status not only of infants but also of whole population and of the socio-economic condition under which they live. The IMR was 28 deaths per 1,000 live births. (Nepal Demographic and Health Survey, 2022)

e. Under 5 Mortality Rate (U5MR): UNICEF defined U5MR as the annual number of death of children aged under 5 years, expressed as a rate per 1000 live births. It measures the death between birth and exactly 5 years of age. This rate can be used to reflect both infant and child mortality rates. The under-5 mortality rate was 33 deaths per 1,000 live births. (Nepal Demographic and Health Survey, 2022)

f. Child Mortality Rate (CMR): The number of death at ages 1-4 years in a given year per 1000 children in that age group in an area. It excludes infant mortality.

g. Maternal Mortality Rate (MMR): – According to WHO “a maternal death is defined as the death of a woman while pregnant or within 42 days of termination of pregnancy, irrespective of the duration and site of pregnancy from any cause related to or aggravated by the pregnancy or its management but not from accidental or incidental causes.

In this formula: MMR = (Number of maternal deaths / Number of live births) x 100,000
“Number of maternal deaths” refers to the total number of women who died during pregnancy, childbirth, or within 42 days of pregnancy termination from causes directly related to pregnancy or its management.
“Number of live births” is the total number of live births in the same population during the same time period.
Causes of maternal mortality
- post-partum hemorrhage
- obstructed labour
- hypertension (pre-eclampsia, eclampsia)
- infection
h. Case fatality rate: –Case fatality rate, also called case fatality ratio, in epidemiology, the proportion of people who die from a specified disease among all individuals diagnosed with the disease over a certain period of time. It is usually used in acute infectious disease e.g. diarrhea, cholera, measles, food poisoning etc. Case fatality rate typically is used as a measure of disease severity and is often used for prognosis (predicting disease course or outcome), where comparatively high rates are indicative of relatively poor outcomes. It also can be used to evaluate the effect of new treatments, with measures decreasing as treatments improve. Case fatality rates are not constant; they can vary between populations and over time, depending on the interplay between the causative agent of disease, the host, and the environment as well as available treatments and quality of patient care.

2. Morbidity Indicators
Describing health solely in terms of mortality rate is misleading because mortality indicators alone do not reveal the complete burden of ill-health in a community, such as mental illness and rheumatic arthritis. Therefore, morbidity indicators are used to supplement mortality data and provide a more comprehensive picture of the health status of a population.
Morbidity is defined as ‘any departure or deviation from a state of physiological well-being,’ and the term is used interchangeably with concepts like sickness, illness, and disability. According to the WHO expert committee, morbidity can be measured in terms of three units:
- The number of people who were ill.
- The duration of the illness period experienced by these individuals.
- The overall duration (in days, weeks, etc.) of these illnesses.”
I. Incidence rate: The number of new cases of a disease occurring in a defined population during a specified period of time.

The above definition refers that incidence rate means:
- Only to new cases
- During a given period (usually one year)
- In a specified population at risk
- New spells or episodes of disease arising in a given period of time.
Special incidence rates
- Attack rate: Used only when the population is exposed to risk for a limited period of time such as during an epidemic. Usually expressed as a percentage.

b. Secondary attack rate: The number of exposed person developing the disease within the range of the incubation period following exposure to primary case.

II. Prevalence rate: It refers specifically to all current cases (old and new) existing at a given point in time or over a period of time in a given population. The total number of all individuals who have had an attack of the disease (old + new) at a particular time (or during a particular period) divided by population at risk of having the disease at this point in time or midway through the year.

Types of prevalence
- Point prevalence
- Period prevalence
Point prevalence: The number of all current cases (old and new) of diseases at one point (days, week, month) in time in relation to defined population.

Period prevalence: It measures the frequency of all current cases (old and new) existing during a defined period of time (e.g. annual prevalence) expressed in relation to a defined population.

3. Fertility Indicators
Fertility indicators are measurements used to assess and quantify the reproductive behavior of a population, particularly in the context of childbearing. These indicators provide insights into the birth rates within a specific population.
Fertility, also known as natality, refers to the actual instances of childbearing within a population. It measures how many children are born to women of reproductive age in a given area during a specific time period. Women’s reproductive years are typically considered to be between 15- 49 years of age.
a. Crude Birth Rate (CBR): The crude birth rate is one of the most straightforward indicators of fertility. It is calculated as the number of live births that occur in a given year within a specific geographical area, per 1,000 people of the estimated mid-year population for that area.

It is not an appropriate measurement of fertility because the total population is not exposed to child bearing. Therefore, it does not give a true idea of the fertility of a population.
b. General Fertility Rate (GFR):The GFR is calculated as the number of live births that occur in a given year in a specific area, per 1,000 women in the reproductive age group (15-49 years) in the same area during the same year. The formula is:

Unlike the crude birth rate (CBR), which uses the entire population as the denominator, the GFR narrows down the denominator to only women within the childbearing age range. This provides a more accurate picture of the fertility potential within a specific group of women.
c. Age-Specific Fertility Rate (ASFR): ASFR is a measure of fertility that focuses on particular age groups of live birth in a year to 1000 women within the reproductive age range. These age groups are often divided into 5-year intervals (20-24 years, 25-29 years, 30-34 years, 35-39yrs, 40-44yrs, 45-49yrs).

d. Total fertility rate (TFR): The number of children a woman can bear throughout her life span. It is a measure of the fertility of an imaginary woman who passes through her reproductive life subject to all the age specific fertility rates for ages 15-49 years that were recorded for a given population in a given year. It can be calculated by summing up the ASFR for all ages; if 5 years’ age groups are used, the sum of the rates is multiplied by 5 and divided number by 1000.
Calculation: To calculate the TFR, you sum the age-specific fertility rates (ASFRs) for specific age groups, usually in 5-year intervals, covering the reproductive age range (commonly 15-49 years),and then multiply this sum by the width of each age interval (usually 5) and divide the result by 1,000. The formula is:
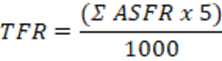
The Σ symbol represents the summation over all the age-specific fertility rates within the specified age range.
e. Pregnancy rate: It is the ratio of number of pregnancies in a year to married women in the ages 15-49 years. The number of pregnancies includes all pregnancies whether those had terminated as live births, still births or abortion had not yet terminated.

f. Abortion rate: It assesses the number of all types of abortions within a population, often expressed as a rate per 1,000 women of childbearing age. It provides insights into the prevalence of abortions within a specific age group and is typically used for studying reproductive health and abortion-related trends.

g. Marriage rate: The crude marriage rate measures the number of marriages that occur in a given year, typically per 1,000 people in the total population. It is indeed a simple and general measure of marriage in a population, as the denominator includes the entire population, not just those eligible to marry.

General Marriage Rate (GMR):The general marriage rate is a more specific measure of marriage because it considers the number of marriages in a year relative to the number of unmarried people within the specific age group generally considered of marrying age (typically ages 15-49 years). A more sensitive rate is the general marriage rate.

h. Contraceptive prevalence rate (CPR): CPR, which is a crucial demographic and public health indicator used to assess the percentage of married women of reproductive age who are currently using any modern contraceptive method at a specific point in time. The CPR is an essential measure for understanding and monitoring family planning and reproductive health practices within a population.

i. Couple years of protection (CYP): Number of years for which a couple would be protected from being pregnant by modern contraceptive methods provided during the year.
CYP = (Number of contraceptive users during the year) x (Number of years in the year)
Number of Contraceptive Users during the Year: This refers to the total number of couples or individuals who are using modern contraceptive methods during the specific year. It includes those who continue using contraceptives and those who initiate contraceptive use.
Number of Years in the Year: This is usually 1 for a single calendar year.
4. Disability rates
Disability rates related to illness and injury have been utilized to supplement mortality and morbidity indicators.
Disability rates are classified into two categories:
- Event-type Indicators:
- Number of days with restricted activity.
- Bed disability days.
- Work-loss days within a specified period.
2. Person-type Indicators:
- Limitation of mobility (e.g., confined to bed, confined to house, requiring special aid for movement).
- Limitation of activity (e.g., limitations in performing basic activities of daily living such as eating, washing, dressing, etc.)
Sullivan’s Index refers to “expectation of life free of disability”.
- Sullivan’s Index = life expectancy of the country -probable duration of bed disability and inability to perform major activities.
- It is considered as one of the most advanced indicators currently available.
Health Adjusted Life Expectancy (HALE)
- Based on the framework of WHO’s ICIDH (International Classification of Impairments, Disabilities, and Handicaps)
- Based on life expectancy at birth but includes an adjustment for time spent in poor health.
- It is the equivalent number of years in full health that a newborn can expect to live based on current rates of ill-health and mortality.
Disability Adjusted Life Years (DALYs)
• It is defined as the number of years of healthy life lost due to all causes whether from premature mortality or disability.
• It is the simplest and the most commonly used measure to find the burden of illness in a defined population and the effectiveness of the interventions
Two things needed to measure DALYs are
- Life table of that country, to measure the losses from premature deaths
- Loss of healthy life years resulting from disability; the disability may be permanent (polio) or temporary (TB, leprosy), physical or mental.
DALY = years of life lost + years lost to disability
One DALY is one lost year of healthy life
DALY = YLL + YLD
YLL = Years of Lost Life = no. of deaths at each age multiplied by the expected remaining years of life according to a global standard life expectancy (LE). Japanese LE is used as the global standard.
YLD = Years Lost to Disability = no. of incident cases due to injury and illness is multiplied by the
- Average duration of the disease and
- A weighting factor reflecting the severity of the disease on a scale from 0 to 1
- Severity score = 0 =perfect health
- Severity score = 1 = death
One DALY = one year of health life lost.
QALY (Quality Adjusted Life Year)
- It is the most commonly used to measure the cost effectiveness of health interventions.
- It estimates the number of years of life added by a successful treatment or adjustment for quality of life.
- Each year in perfect health is assigned a value of 1.0 down to a value of 0.0 for death
Example:
- If an individual has perfect health for one year, that person will have QALY
(1 Year of Life × 1 Utility Value = 1 QALY)
- If an individual lives in perfect health but only for half a year, that person will have 0.5 QALYs. (0.5 Years of Life x 1 Utility Value = 0.5 QALYs)
- Likewise, if an individual lives for for 1 year in a situation with 0.5 utility (half of perfect health), that person will also have 0.5 QALYs. ( 1Year of Life x 0.5 Utility Value = 0.5 QALYs)
5. Nutritional status indicators:
Nutritional status is a positive health indicator. Three nutritional status indicators are considered important as indicators of health status. They are measured for newborn their;
- Birth weight
- Length
- Head circumference.
They reflect the maternal nutrition status.
Anthropometric measurements of pre-school children
- Weight – measures acute malnutrition
- Height – measures chronic malnutrition
- Mid-arm circumference – measures chronic malnutrition
- Underweight: weight for age < –2 standard deviations (SD) of the WHO Child Growth Standards median
- Stunting: height for age < –2 SD of the WHO Child Growth Standards median
- Wasting: weight for height < –2 SD of the WHO Child Growth Standards median
- Overweight: weight for height > +2 SD of the WHO Child Growth Standards median
Growth Monitoring of children is done by measuring weight-for-age, height-for-age, weight-for- height, head & chest circumference and mid-arm circumference.
In adults Underweight, Obesity and Anemia are generally considered reliable nutritional indicators.
6. Health care delivery indicators
These indicators reflect the equity of distribution of health resources in different parts of the country and of the provision of health care. Doctor-population ratio, Doctor-nurse ratio, Population-bed ratio, Population per health/sub-center etc.
Ratio of selected staff to population ratios — Nepal was found to have 0.17 doctors per 1,000/population and 0.50 nurses per 1,000/population. This represents 0.67 doctors and nurses per 1,000/population, which is significantly less than the WHO recommendation of 2.3 doctors, nurses and midwives per 1,000/population.
7. Utilization rates
Utilization Rates or actual rates is expressed as the proportion of people in need of a service who actually receive it in a given period, usually a year
It depends on availability & accessibility of health services and the attitude of an individual towards health care system
They direct attention towards discharge of social responsibility for the organization in delivery of services
- Proportion of infants who are fully immunized against the EPI diseases.
- Percentage of population using the various methods of family planning.
8. Indicators of social and mental health
- These include rates of suicide, homicide, other crime, road traffic accident, juvenile delinquency, alcohol and substance abuse, domestic violence, battered-baby syndrome, etc.
- These indicators provide a guide to social action for improving the health of people.
- Social and mental health of the children depend on their parents.
- E.g. Substance abuse in orphan children.
7. Environmental indicators
- These reflect the quality of physical and biological environment in which diseases occur and people live.
- The most important are those measuring the proportion of population having access to safe drinking water and sanitation facilities.
- These indicators explain the prevalence of communicable diseases in a community.
- The other indicators are those measuring the pollution of air and water, radiation, noise pollution, exposure to toxic substances in food and water.
8. Socioeconomic indicators
These do not directly measure health but are important in interpreting health indicators. It includes:
- Rate of population decrease
- Per capita GNP (gross national product)
- Level of unemployment
- Dependency ratio etc.
GDP (Gross Domestic Product)-= the total value of all final products produced in a country during a specific time period (economic output). GDP is also the total amount of money that the economy spends to buy final products (goods, services, ideas).
The major spenders are:
- consumers-food, clothes, medical care, cars, tickets
- business- computers, warehouse, machinery
- government- national defense, food for school lunch programs, police protection, road
GDP= Consumption + Investment + (Government spending) + (exports-imports)
GNP (Gross National Product)- an estimated value of the total worth of products and services, by citizens of a country, on its land or on foreign land, calculated over the course of one year.
GNP=GDP+NR (Net income inflow from assets abroad or Net income receipts) – NP (Net payment outflow to foreign assets)
National Statistical Office of Nepal: (2023) Per-capita incomes in US$ 1410 (NRs- 87,457)
9. Health policy indicators
The single most important indicator of political commitment is allocation of adequate resources.
The relevant indicators are:
- Proportion of GNP spent on health services.
- Proportion of GNP spent on health related activities like water supply and sanitation & housing and nutrition.
- Proportion of total health resources devoted to primary health care.
10. Indicators of quality of life
Life expectancy is now less important. The Quality of Life has gained its importance.
- Physical Quality of Life Index (PQLI)
- It consolidates infant mortality, life expectancy at age of 1year and literacy.
- For each component the performance of individual country is placed on a scale of 1 to 100.
- The composite index is calculated by averaging the three indicators giving equal weight to each of them.
- The result is placed on the 0 to 100 scale.
- The PQLI does not consider the GNP.
11. Other indicators
Social indicators
- Population
- Family formation
- Families and house holds
- Learning and educational services
- Earning activities
- Distribution of income
- Consumption and accumulation
- Social security and welfare services
- Health services and nutrition
- Housing and its environment
- Public order and safety
- Time use
- Leisure and culture
- Social stratification and mobility
Basic needs indicators
Those mentioned in “basic needs performance” which includes:
- Calorie consumption
- Access to water
- Life expectancy
- Deaths due to diseases
- Illiteracy
- Doctors and nurses per population
- Rooms per person
- GNP per capita.
Health for All indicators
For monitoring progress for goal of Health for all by 2000 AD, WHO categorizes four Indicators:
- Health policy Indicators
- Social and economic indicators related to health
- Indicators for provision of health care
- Health status indicators
Millennium development goal indicators:
The MDG’S adopted by United Nations in the year 2000, provides an opportunity for concerned action to improve global health. It has eight goals, eighteen targets and forty-eight indicators.
Life expectancy:-The average number of years which a person of that age may expect to live, according to the mortality pattern prevalent in that country. It measures the average number of year a man would survive or live from birth. It is considered as the best indicator to assess the country’s level of development and of the overall health status of its population. As an indicator of long-term survival, it can be considered as a positive health indicator. It has been adopted as a global health indicator. A minimum life expectancy at birth of 60 years is the goal of Health for All by 2000 AD.
Worldwide life expectancy at birth (years) has improved by 6.52 years from 66.8 years in 2000 to birth of 73.3 years. In Nepal life expectancy at birth (years) has improved by 5.62 years from 65.3 years in 2000 to 70.9 year (WHO, 2019)
Years of potential life lost (YPLL)/potential years of life lost (PYLL)
Measures the impact of mortality on society;
- a measure of premature mortality, or early death
- calculated by summing the years that individuals would have lived had they experienced normal life expectancy and had not died from the particular disease
- Often, age 65 (or 75) is used in the calculation
- For example, a person who died at age 30 from heart disease (65 – 30 = 35 YPLL)
Use of vital and health statistics
The utilization of vital and health statistics serves various purposes:
- Measurement of State of Health: It is employed to gauge the health status of a community, identifying health problems and needs, such as determining the incidence and prevalence rates of certain diseases. This includes assessing the status of child health (e.g., Infant Mortality Rate, Child Mortality Rate, U 5 Mortality Rate) and maternal health (Maternal Mortality Rate).
- Comparison of Health Status: Vital and health statistics are crucial for local, national, and international comparisons of health status, allowing for comparisons of current health conditions with historical data.
- Planning: These statistics play a vital role in the planning, administration, and effective management of health services and programs. Planning involves the decision-making process that helps determine future actions.
- Assessment: They are integral to the organized and systematic process of collecting data from various sources to analyze the health status of individuals, families, or communities. This assessment is crucial for evaluating health care delivery systems, including immunization services, family planning, and nutrition programs.
- Evaluation: Vital and health statistics are used to evaluate the progress, success, or failure of health services and programs. For instance, a decrease in the Crude Birth Rate indicates the success of a Family Planning program.
- Research: These statistics are employed for conducting research into specific health problems and diseases within communities.
Sources of Vital and Health Statistics:
Census:
A census is the comprehensive process of collecting, compiling, analyzing, evaluating, and publishing demographic, economic, and social data for all individuals in a country or a defined territory at specific times. According to Nation (1970), it involves reaching every member of the population within a specified timeframe to gather diverse information.
De-facto Method: This approach involves collecting data from all individuals present in the household or living in a quarter on the census day or those who spent the night at a specific location.
De-jure Method: This method includes listing all persons who usually reside in a household, whether they are present or not on the census day. However, it may lead to issues such as duplication or omission.
Advantages of Census:
- Provides a wide range of information, including demographic, social, religious, economic, and health status data.
- Offers essential data for administration, planning, research, and health services.
- Facilitates the determination of vital statistics like Crude Birth Rate (CBR), Crude Death Rate (CDR), Infant Mortality Rate (IMR), etc.
- Assists in estimating future requirements for health services, manpower, food, water, etc.
- Enables the comparison of current health statuses with the past and among different national or international regions.
- Aids in demarcation of areas, allocation of manpower, and services.
Disadvantages of Census:
- High cost associated with conducting a census.
- Requires a large workforce for implementation.
- Geographical variations and security concerns may lead to incomplete reporting.
- Time-consuming analysis and publication process.
Vital Registration System:
Vital records pertain to significant life events such as births, deaths, migration, divorce, and marriages. The systematic recording of these vital events by the relevant authorities is known as the Vital Registration System. The registered events are then compiled, and the resulting statistics are referred to as vital statistics.
Advantages:
- Up-to-date fertility and mortality data: complete registration provides current and accurate data on fertility and mortality, offering valuable insights into demographic trends.
- In-depth demographic information: the system yields comprehensive demographic data, aiding in population estimation and projection.
- Evaluation of family planning programs: it assists in evaluating the effectiveness of family planning programs, allowing for informed decision-making.
- Analysis of causes of death: through death certificates, the system enables the analysis and assessment of causes of death, contributing to public health understanding.
- Utilization for planning, administration, and research: vital statistics obtained from the registration system are instrumental for planning, administration, and research purposes in various fields.
Disadvantages:
- The data collected may be incomplete due to underreporting or non-registration of certain vital events.
- Accuracy may be compromised by errors or discrepancies in the recorded information.
- Inconsistencies in reporting practices can lead to variations in data quality.
Notification of Diseases:
The recording and reporting system for commonly occurring diseases within a specified authority is referred to as the notification of diseases. This system offers up-to-date information on the incidence, distribution, and prevalence of notifiable diseases. The primary objective of notification is to facilitate effective prevention and control of diseases within the community. Notifiable diseases can vary from country to country and between urban and rural areas; for example, Acute Respiratory Infections (ARI) in hilly regions, malaria in the Terai region, and diarrhea in rural areas.
Advantages:
- Valuable Disease Information: Provides essential data on the frequency and distribution of diseases, aiding in public health planning.
- Early Detection of Emerging Diseases: Serves as an early warning system for the occurrence of new diseases and epidemic outbreaks.
- Inclusion of Non-Communicable Diseases: Enables notification of non-communicable diseases such as cancer, mental illness, and stroke.
Disadvantages:
- Limited Coverage: Covers only a small fraction of the total sickness within the community.
- Underreporting: Incomplete reporting may occur as individuals may not accurately report their illnesses, leading to underreporting of disease cases.
- Non-Recognition of Atypical Cases: Atypical or subclinical cases may go unreported due to a lack of recognition or awareness.
Records
Records from hospitals, schools, and medical clinics serve as a primary source of information about diseases, particularly in settings where vital registration systems and disease notifications are insufficient.
Advantages of records:
- Information on healthcare activities:
- Provides insights into various healthcare activities.
- Demographic details:
- Geographic area: indicates the geographic locations of patients.
- Age/sex distribution: offers information about the age and sex distribution of patients.
- Ethnicity, race, religion: includes details on the ethnic, racial, and religious backgrounds of patients.
- Disease characteristics:
- Prevalence and duration: indicates the prevalence of diseases and the duration of hospital stays.
- Distribution of diseases: provides insights into the distribution patterns of different diseases.
- Time lag: reveals the period between the occurrence of a disease and hospital admission.
- Social and biological characteristics:
- Distribution based on social and biological factors: includes data on how diseases are distributed among various social and biological characteristics of the patients.
- Cost of hospital care: offers information on the cost associated with hospital care.
Disadvantages of Records:
- Limited coverage:
- Selective population: records typically represent only a fraction of the population, as they are based on individuals seeking treatment at the hospital, school, or clinic.
- Admission policy variability: admission policies can vary among different healthcare institutions, leading to selective inclusion of patients.
- Undefined catchment areas: the population served by a hospital, school, or clinic (population at risk) cannot be precisely defined due to the absence of prescribed catchment area boundaries.
Health survey:
A survey is a process for collecting new information for study, such as a household survey. Health surveys focus on various aspects of health, including morbidity, mortality, fertility, and nutritional status. These surveys cover demography, household population health, and environmental sanitation conditions to identify specific health-related conditions in the community. In Nepal, the first health sample survey was conducted in 1956 AD.
Health survey methods:
- Health interview survey (face-to-face): Involves face-to-face interviews to gather information about health-related aspects.
- Health examination survey: Includes physical examinations to assess the health status of individuals.
- Health records survey: Involves the collection and analysis of health records to derive information.
- Health questionnaire survey: Utilizes structured questionnaires to gather health-related data.
Advantages:
- Cost-effectiveness and efficiency: surveys based on samples are less expensive and easier to conduct, providing quicker results compared to a census.
- Data cross-checking: helps cross-check census data, ensuring data accuracy and reliability.
- Intercensal estimates: provides intercensal estimates of essential demographic parameters, such as birth and death rates.
Disadvantages:
- Limited information: provides limited information on specific health conditions, potentially missing comprehensive insights.
- Limited applicability: results may not be universally applicable if the sample size is small, affecting the generalizability of findings.
- Resource intensive: surveys can be expensive, time-consuming, and challenging to conduct, requiring substantial resources.

You May Also Like

Excreta disposal

Media of health education
